Forests in Cities Climate Tool
By Jeffrey A. Clark
By Jeffrey A. Clark
What is this tool? The tool below uses summarized data from the National Oceanic and Atmospheric Administration (NOAA) to help users visualize changes in climate variables – including maximum temperature and precipitation – over time. This no code approach to figure creation allows for individuals to create custom figures for a broad range of variables.
How to use this tool: Select the city and location you are interested in from the pull down menu. Use the other drop down menus and text boxes to customize the layout of the graph. Download data or the figure you created using the buttons at the bottom of the tool. More information on the data can be found by clicking the “more information” button below.
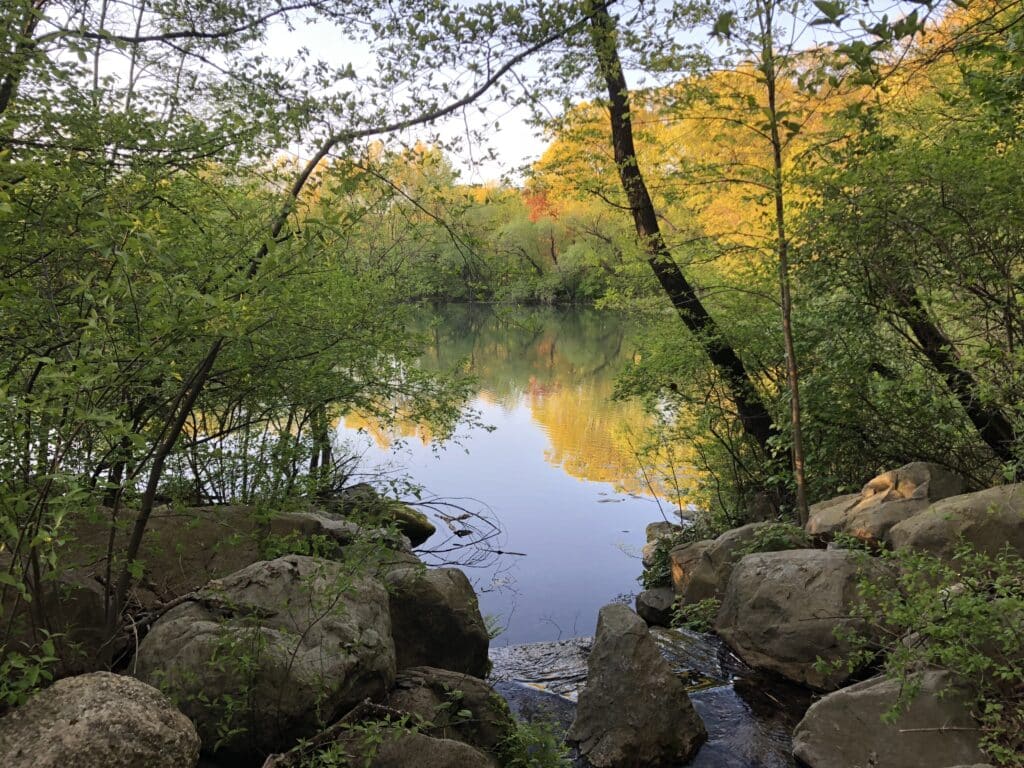
Urban stormwater management is a growing challenge in the face of climate change, especially in cities like New York with aging gray infrastructure and increasing impervious surfaces. This report, “Reducing Runoff: The Role of Urban Natural Areas in Stormwater Management,” presents a comprehensive analysis of how urban natural areas, including ...
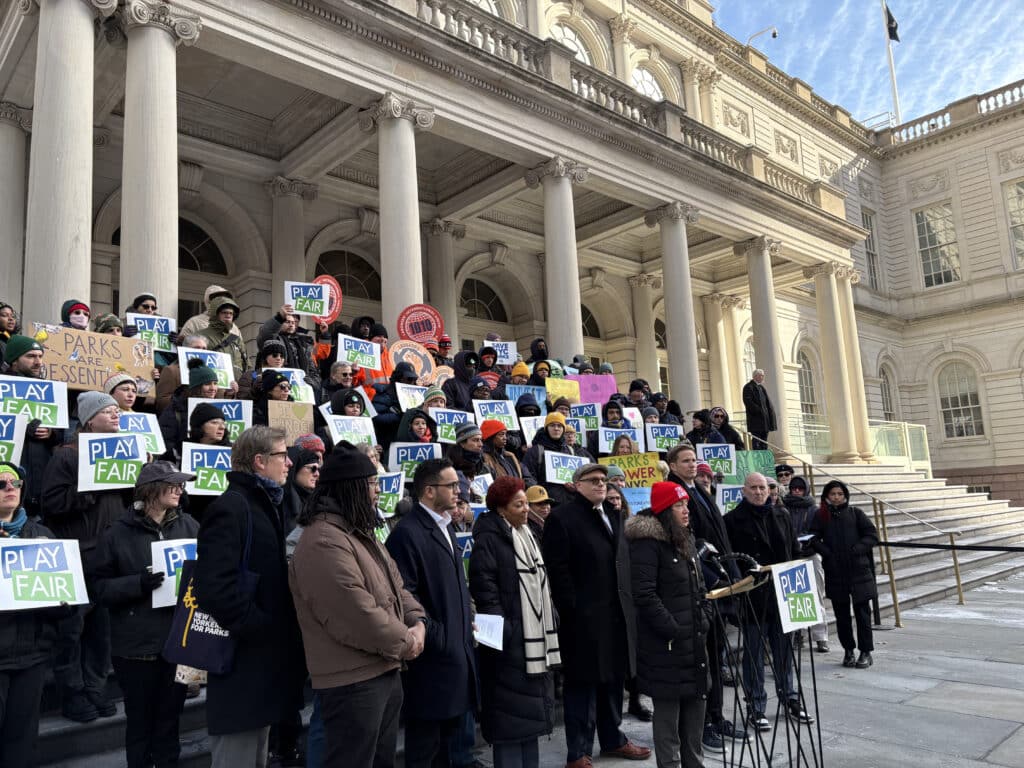
Urban natural areas are crucial for enhancing city livability and environmental health but are often overlooked, underfunded, and missing formal protection, which leads to loss of ecological benefits, missed opportunities for community engagement and nature access, and overall loss of natural areas. Governance structures for urban forested natur...
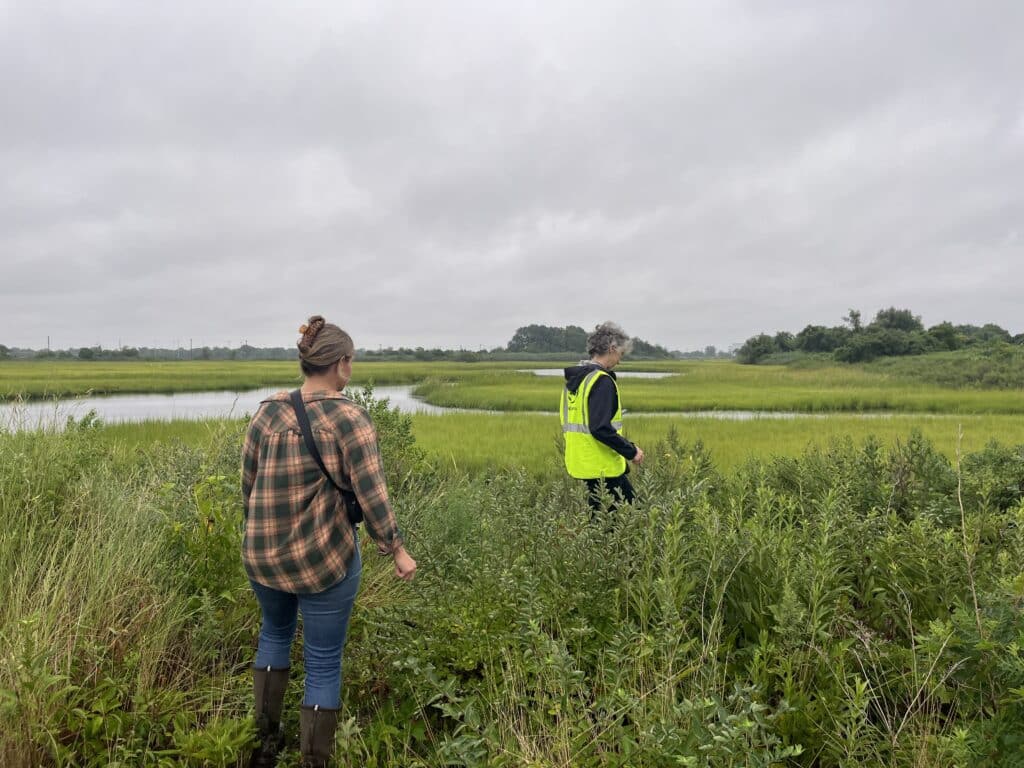
In New York City, tidal wetlands are a critical part of coastal resiliency and provide numerous ecological and social benefits. State and federal wetlands mitigation regulations require that development resulting in wetland impacts offset those losses through wetland creation, restoration, and enhancement – with a ...